Composable Analytics Apps 101
The next generation of workers is more tech-literate than ever before. They were born with smartphones and tablets and understand how apps, networks, and web technologies work. No-code tools that help tech-literate teams compose analytics applications empower this new workforce. The goal is full participation in tech. Some are approaching that goal.
For example, at the Scottish Environmental Protection Agency (SEPA), 80% of over 1,000 staff use data and analytics. That helps more people explore millions of chemistry and ecology samples dating back to the 1960s to drive evidence-based environmental and business decisions.
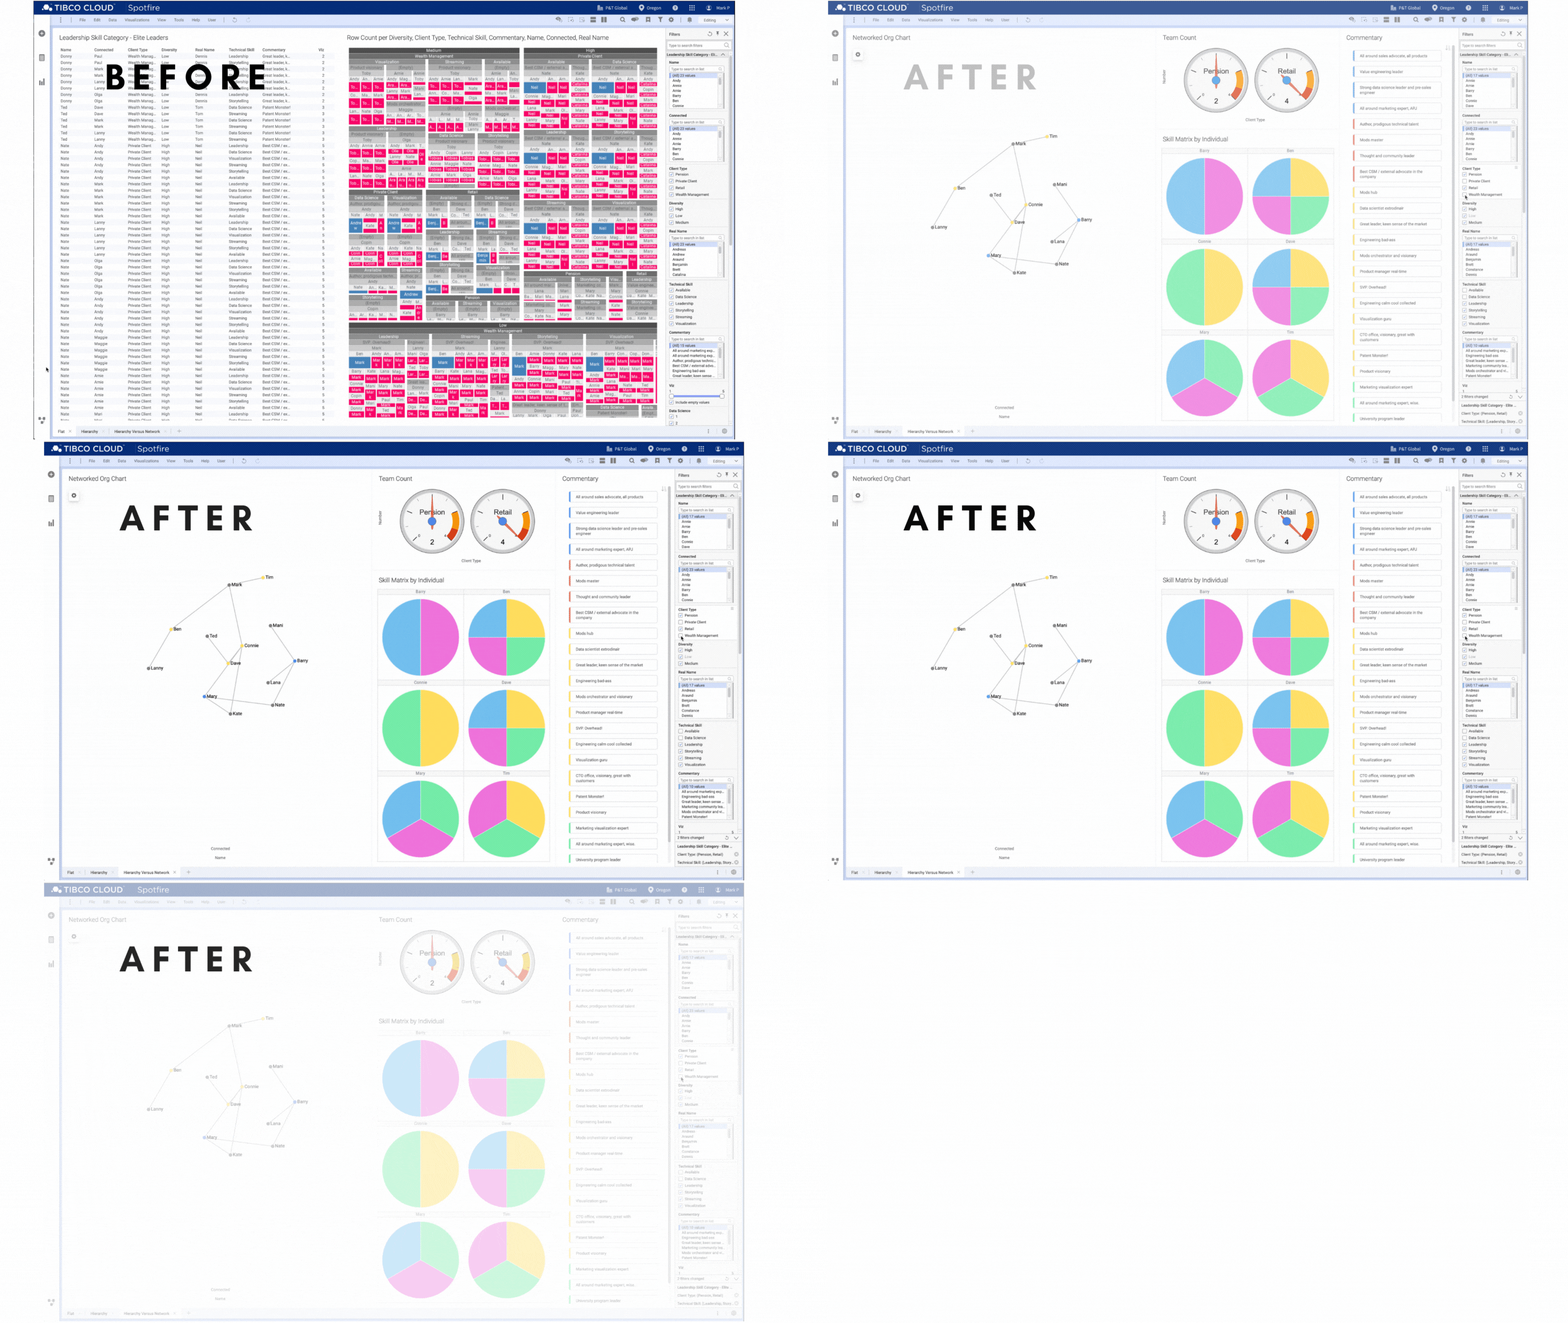
Results like SEPA are why Citizen Development has been called the Most Disruptive Tech Trend Of 2021 by Betsy Atkins. Here’s how it works. The “before” image below shows a typical dashboard you get from a graphing tool—a table of data and a chart. The "after" image is a sophisticated analytics app with five custom components, constructed without coding.
Composable analytics are like programming lego kits. The network chart, speedometers, and prettied-up text areas are called "Mods," or modifications. You drag them on the screen and go. Mods are created and shared by the open-source coding community that has millions of developers.
This Animated Bubble Chart Mod is another example of a no-code Mod. It compares the GDP to life expectancy for every country since the 1800s. It's a beautiful mini-app contributed via open source. The user decides to navigate the chart by clicking on a map—and reconfigures the app in three clicks.
90% of data science models don't get used in the enterprise. Democratized analytics make it easier to share and use data science work.
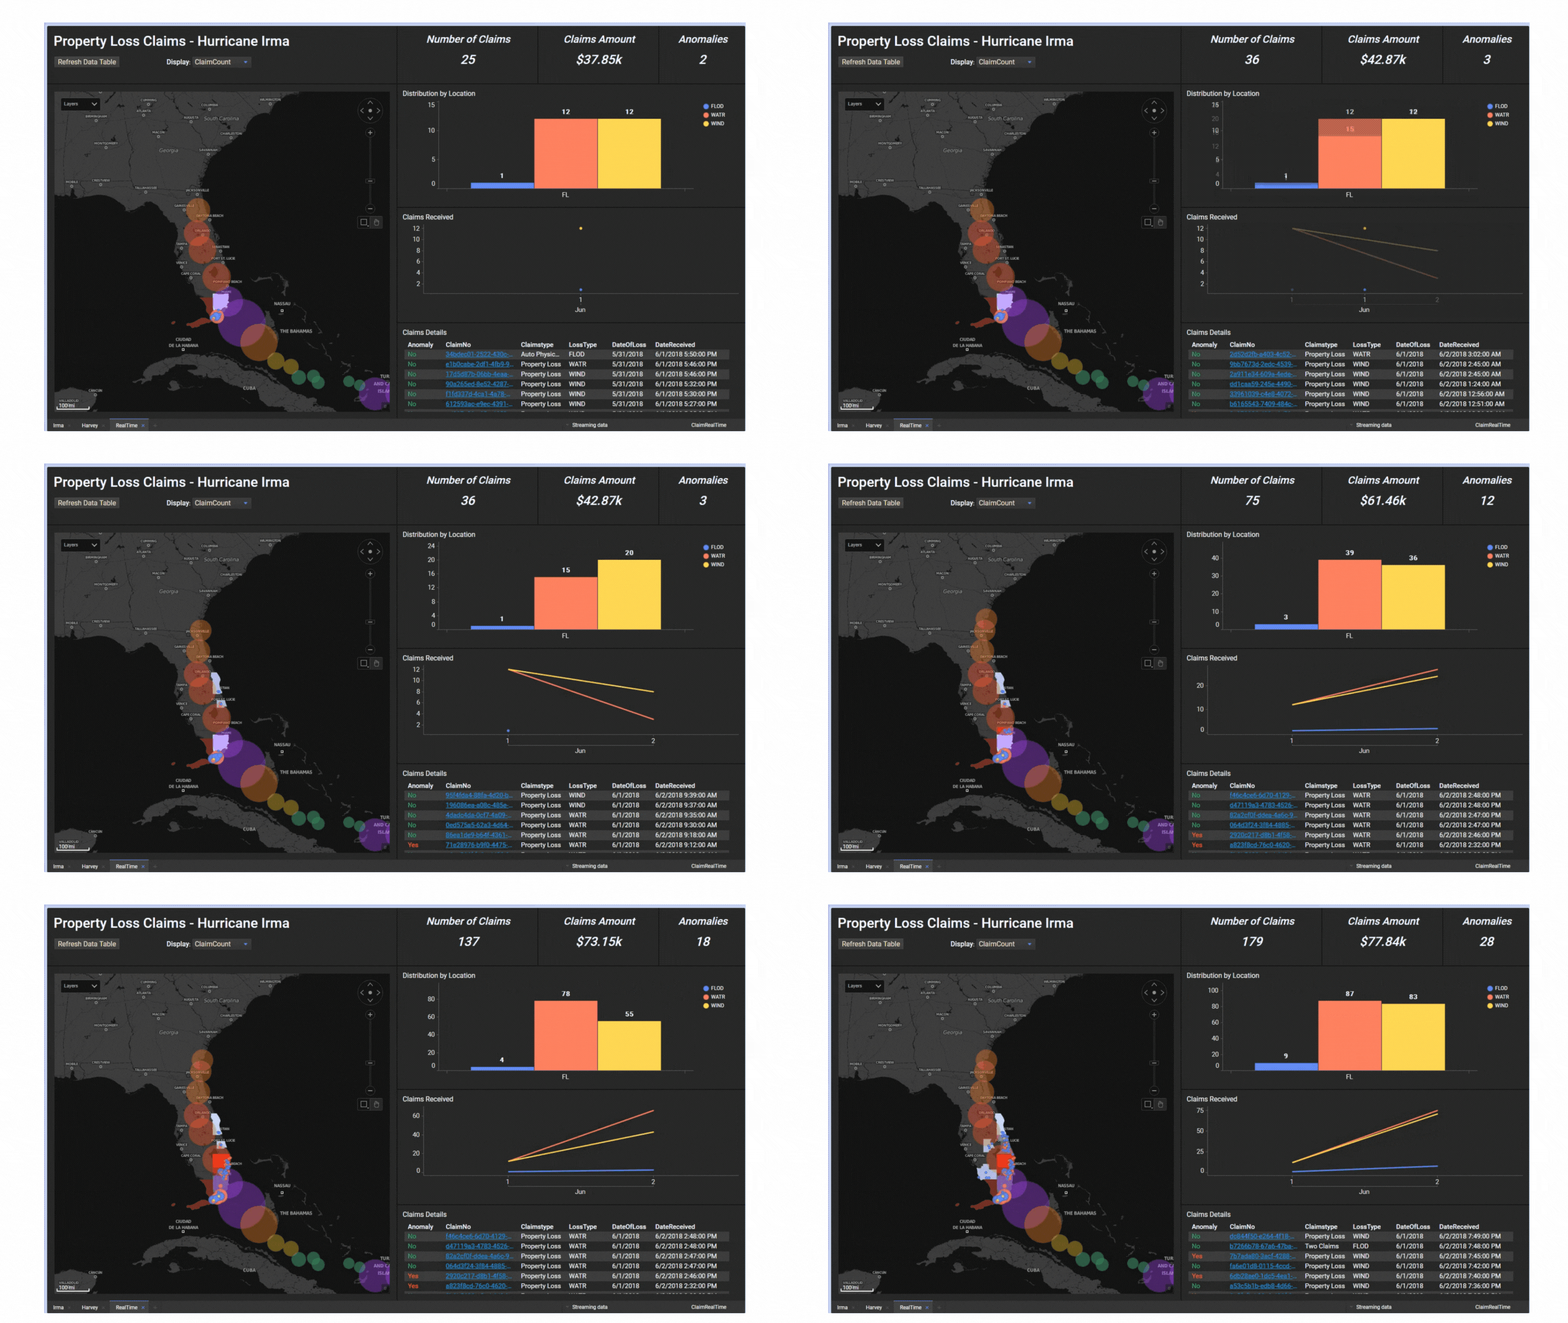
For example, the app below predicts the location and extent of damage as a storm approaches Florida. Predictions come from a machine learning model. The map colors show the certainty and the cost of damage. This application helps an insurance company decide how to deploy adjusters, warn customers, and adjust their supply chain as conditions change.
Maybe Betsy Atkins is right that no-code will be the most disruptive trend of 2021. For analytics, composable analytics platforms and open-source development are engaging more people, yielding great innovation and helping deploy more data science. As more tech-savvy workforce citizens emerge, more are working with data. That may or may not be disruptive, but getting more data to more people can’t be bad!


