Harvard Business Review advises that leadership lies in its connective tissue of a team, not its hierarchy. But in a large organization, how can you uncover great ideas, hidden genius, and diversity? Here’s a no-code analytics application that helps ponder these questions. Step one is: throw your old org chart away.
Then, I created a simple analytics app to help explore “org networks” (not org charts) in a connected, visual way. The short animation below shows it at work—click it to play.
Step two is to describe the connections among your team members, their skills, or anything you need to consider for the task at hand. For example, I have a “diversity of thought” metric I included because I wanted was creating a steering committee that would bring a diverse set of opinions to the table.
In this example, I used my analytics app to explore the best people to work on customer relationships at a bank.
Step three is to explore. I load the data into the Network Org Chart, below. To find someone to lead a team of data scientists connected to sales, I filter by organization. The network reveals two data scientists, Nate and Kate, who are connected to key salespeople.

Here’s a detailed view of how to filter large organizational networks: you filter, click and explore like searching Zillow for a house in your neighborhood, changing factors, thinking, and looking some more:
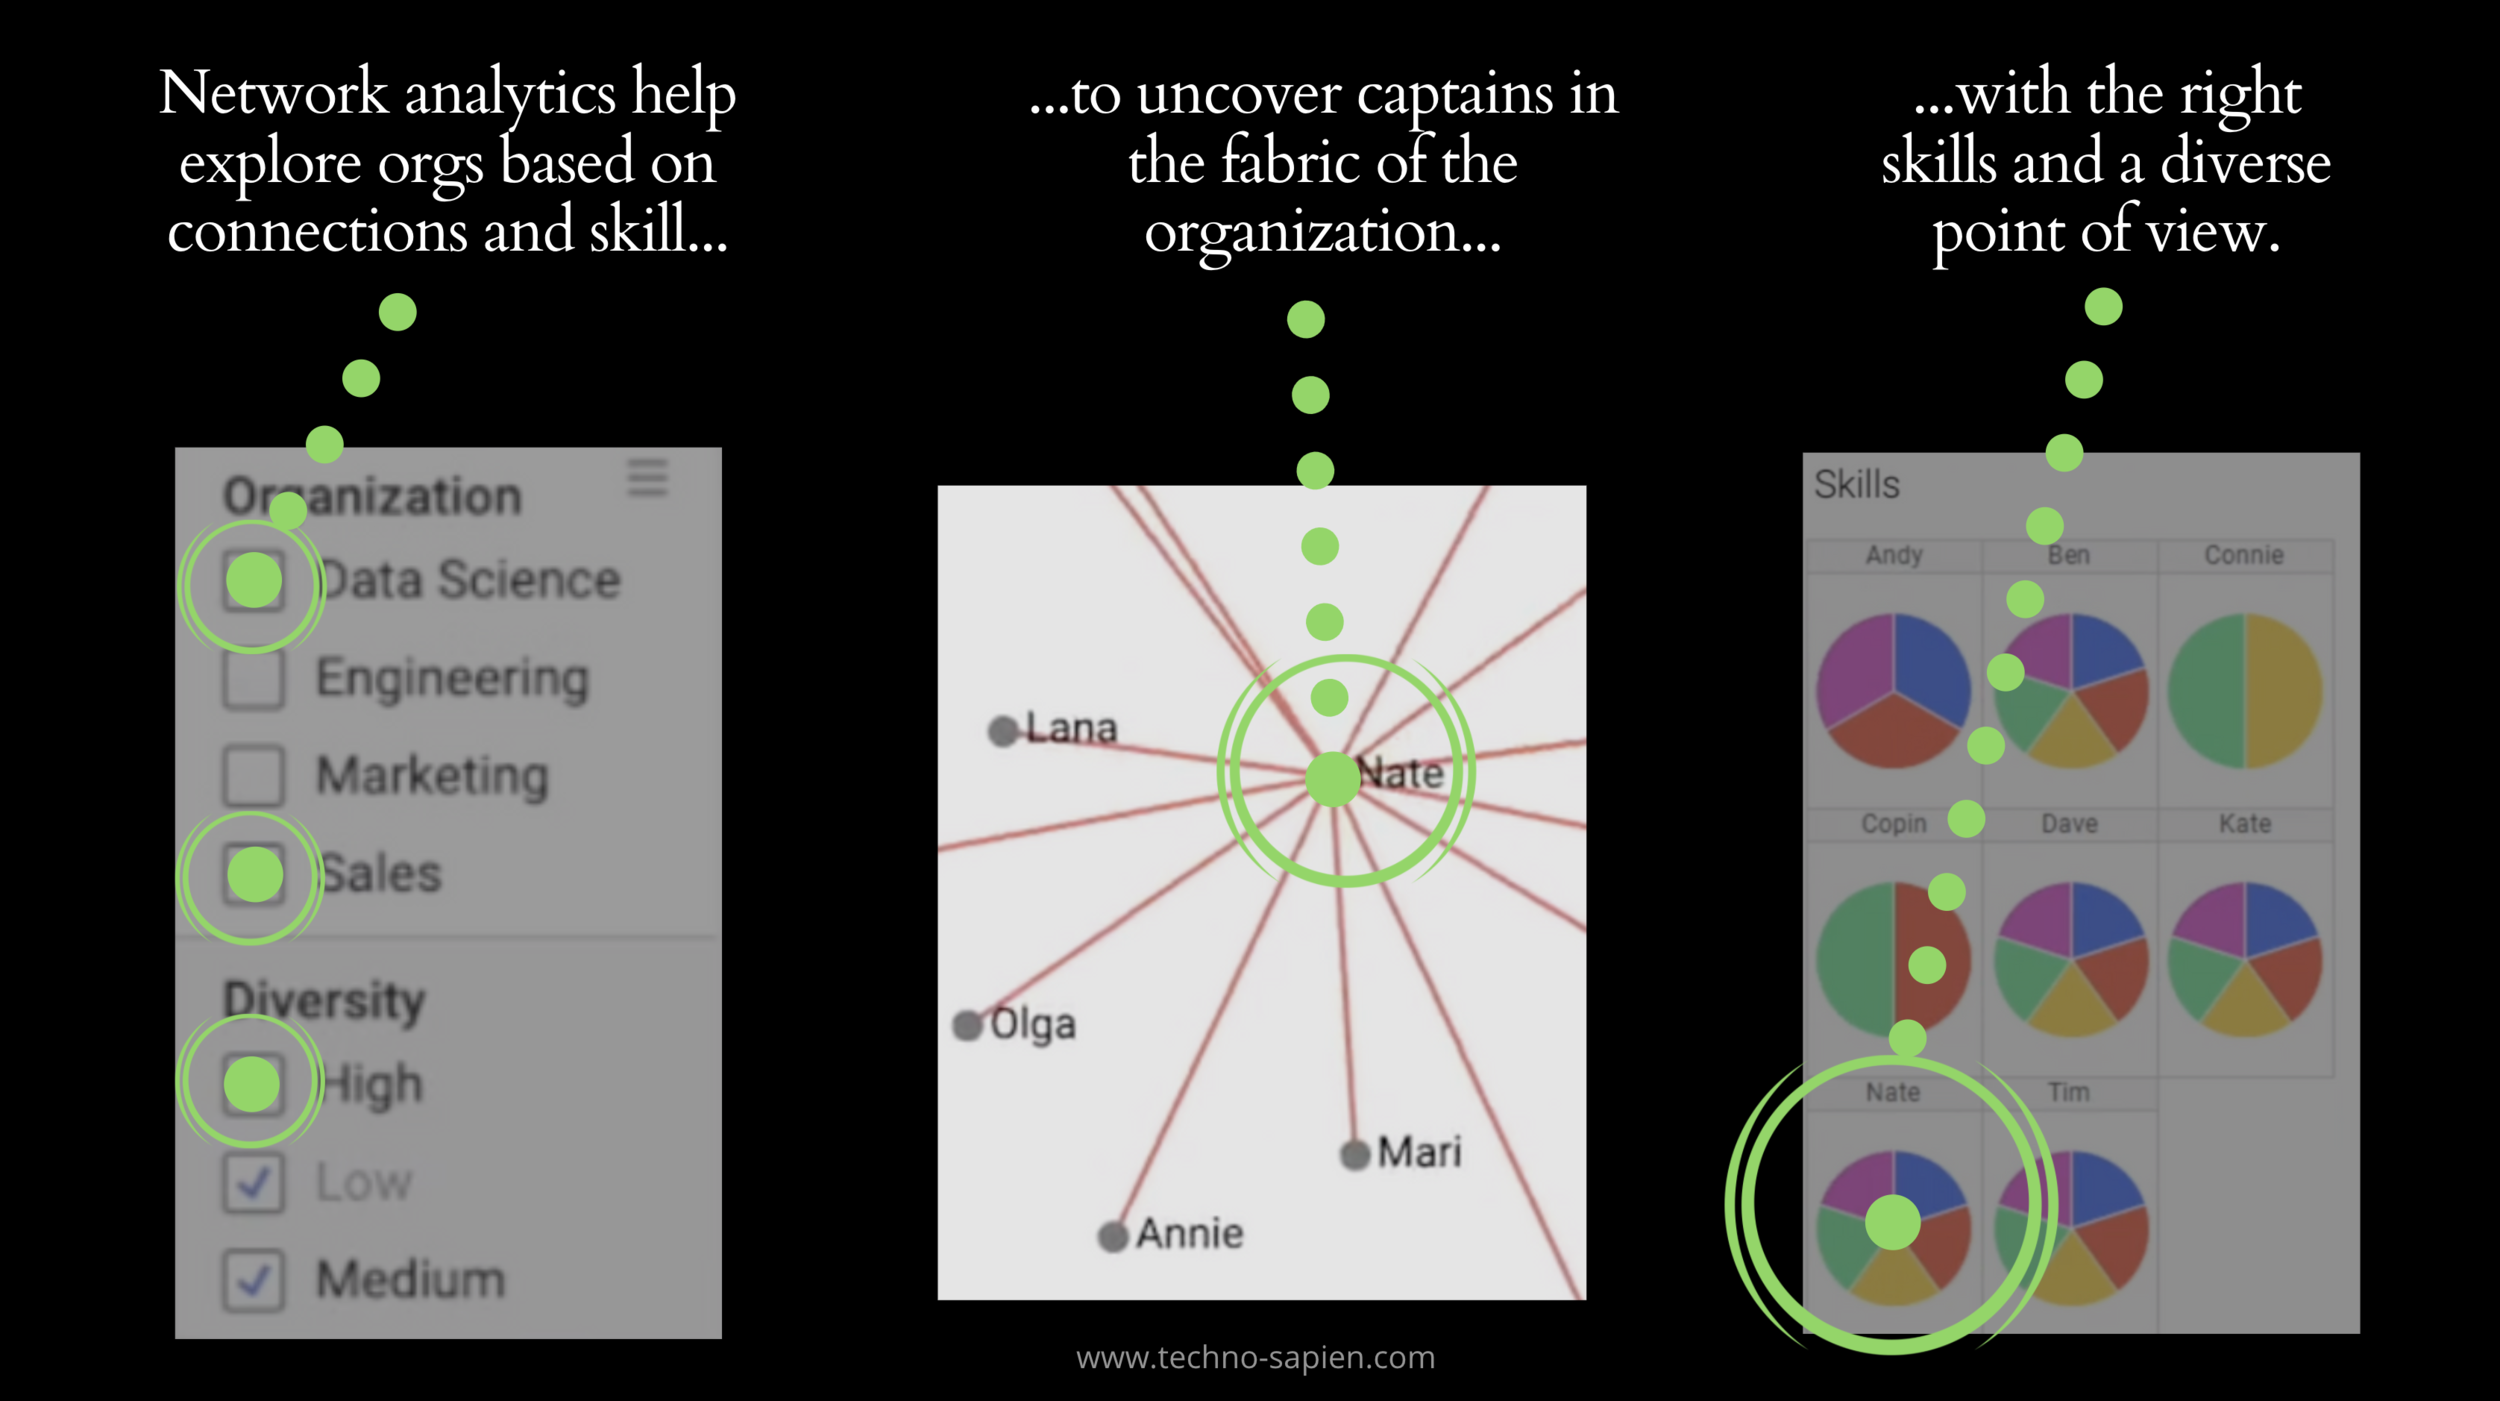
Network Org Charts are a great way to re-think how you look at your organization and leadership decisions. This open-source analytics application can be loaded with any organizational network and any skill-set for analysis.
* * *
Credits: This application was built with the new no-code application framework and the Network Chart Mod by Colin Gray. No-code tools have been called The Most Disruptive Trend Of 2021 by Betsy Atkins. It took a few hours to compose this app. No-code is a new way of thinking about analytics, and now, organization charts!

